Close more of the work you already have.Without hiring anyone to chase it.
Castalin builds the operating system behind home service companies doing $1M+, from the call that starts a job to the invoice that closes it out. That stretch is the part nobody owns, which is where the work goes missing.
Six questions, about two minutes.
The job did not die on price.
It died on a Tuesday, waiting.
You have more trucks than you had, more crews and more revenue than last year. The week got harder anyway, and nothing in your numbers says why.
The place it fell through has no name on it, and it opens three more times after the win: the material, the ETA, the invoice.
Six moments in one job.
Each one gets an owner.
One named person owns it, and a clock starts.
- One named owner
- A clock that starts itself
- Nothing waits on a reminder
The chase runs itself until an answer comes.
- Chased on its own
- An answer either way
- Nothing stalls in a thread
Order, lead time and date sit against the job.
- Order against the job
- Lead time visible
- A week built on facts
The crew logs it where they stand.
- Logged where they stand
- The office sees it live
- No evening reconstruction
Closing the job out sends the invoice.
- Close out sends it
- Nothing trails by weeks
- Paperwork stops lagging
Labour and materials land against the job that used them.
You do not know which jobs made money, so the next bid gets priced on feel and capacity is a guess.
- Cost against the job
- Margin per job visible
- Bids priced on fact




What gets built
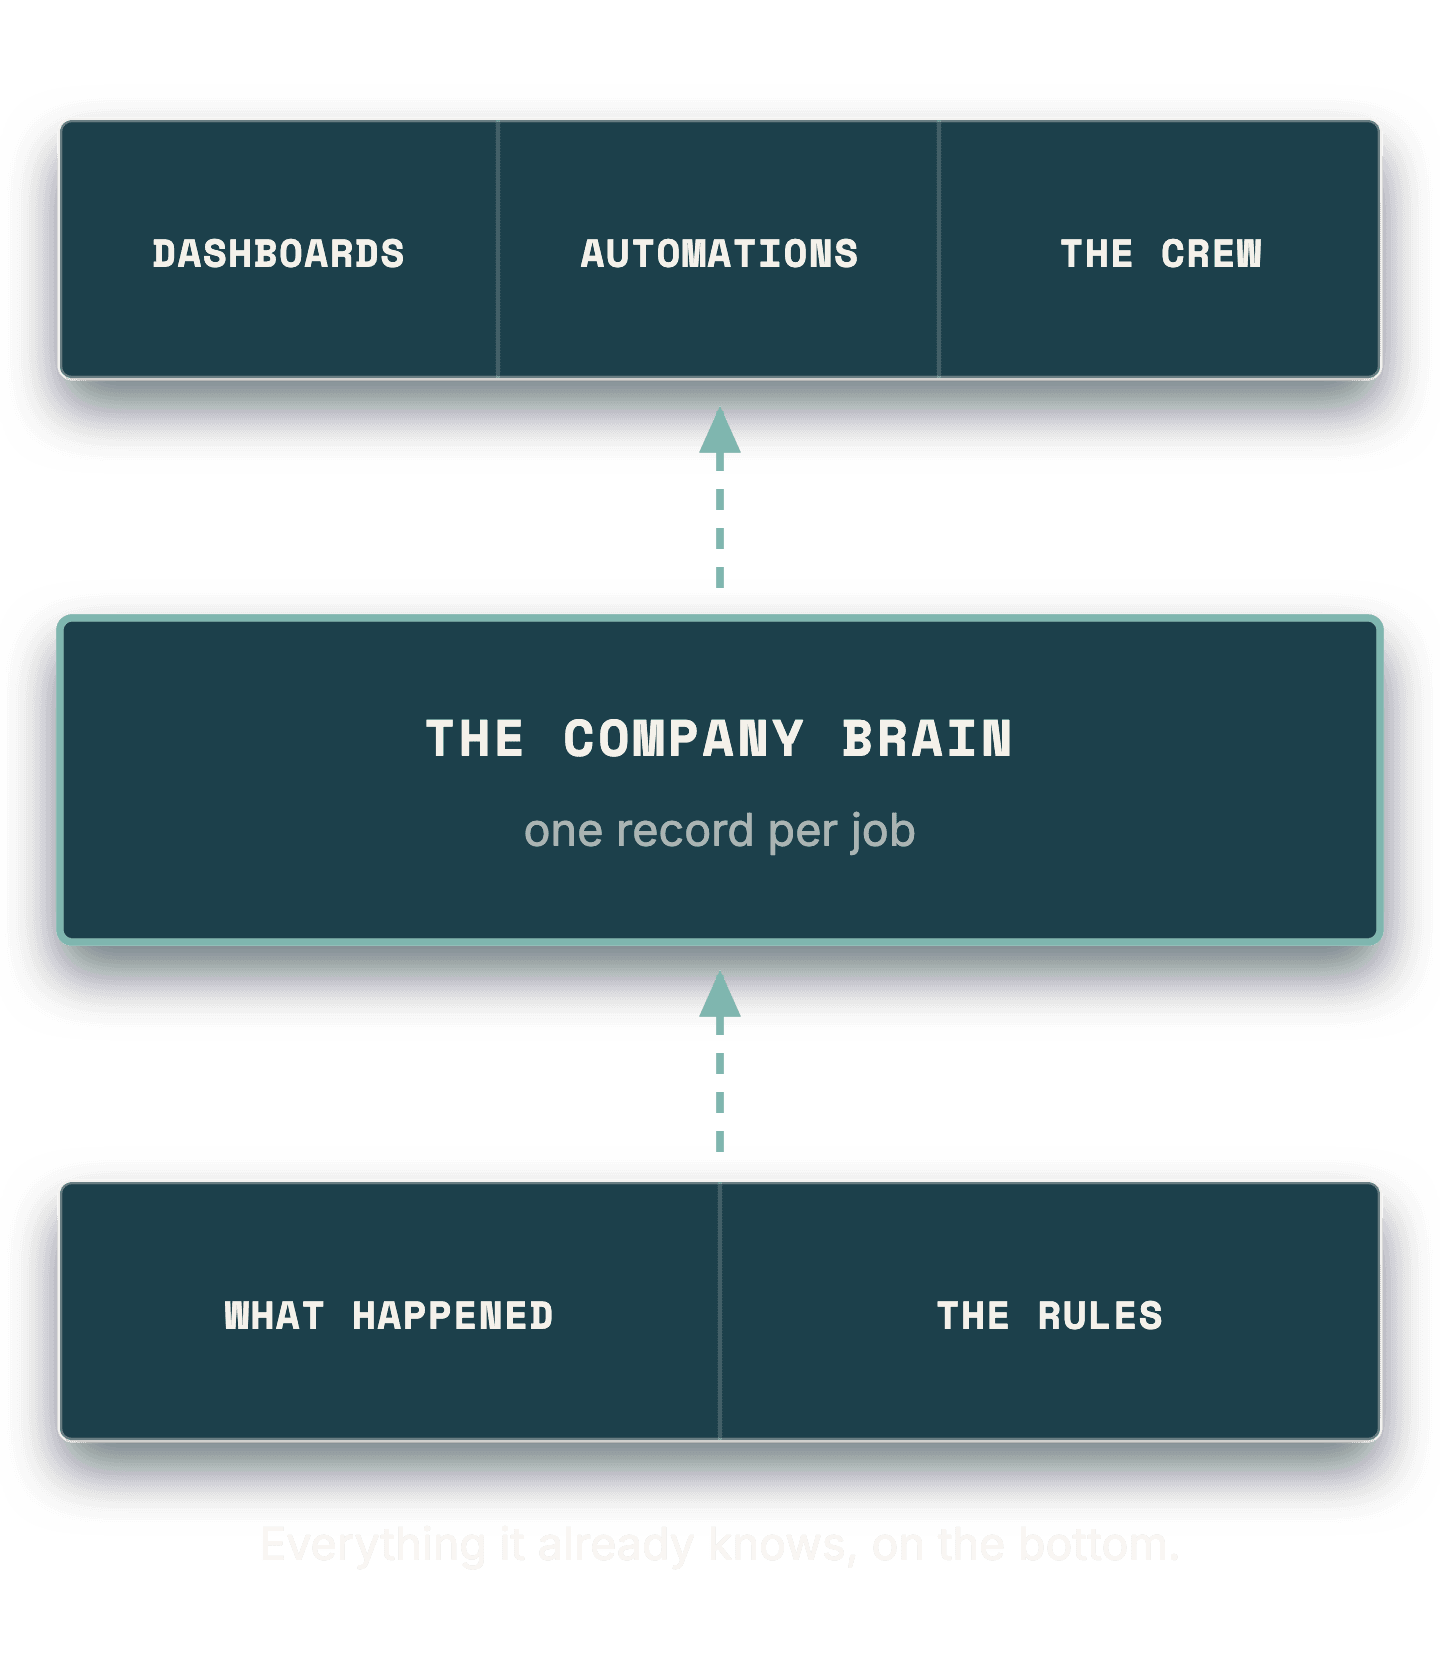
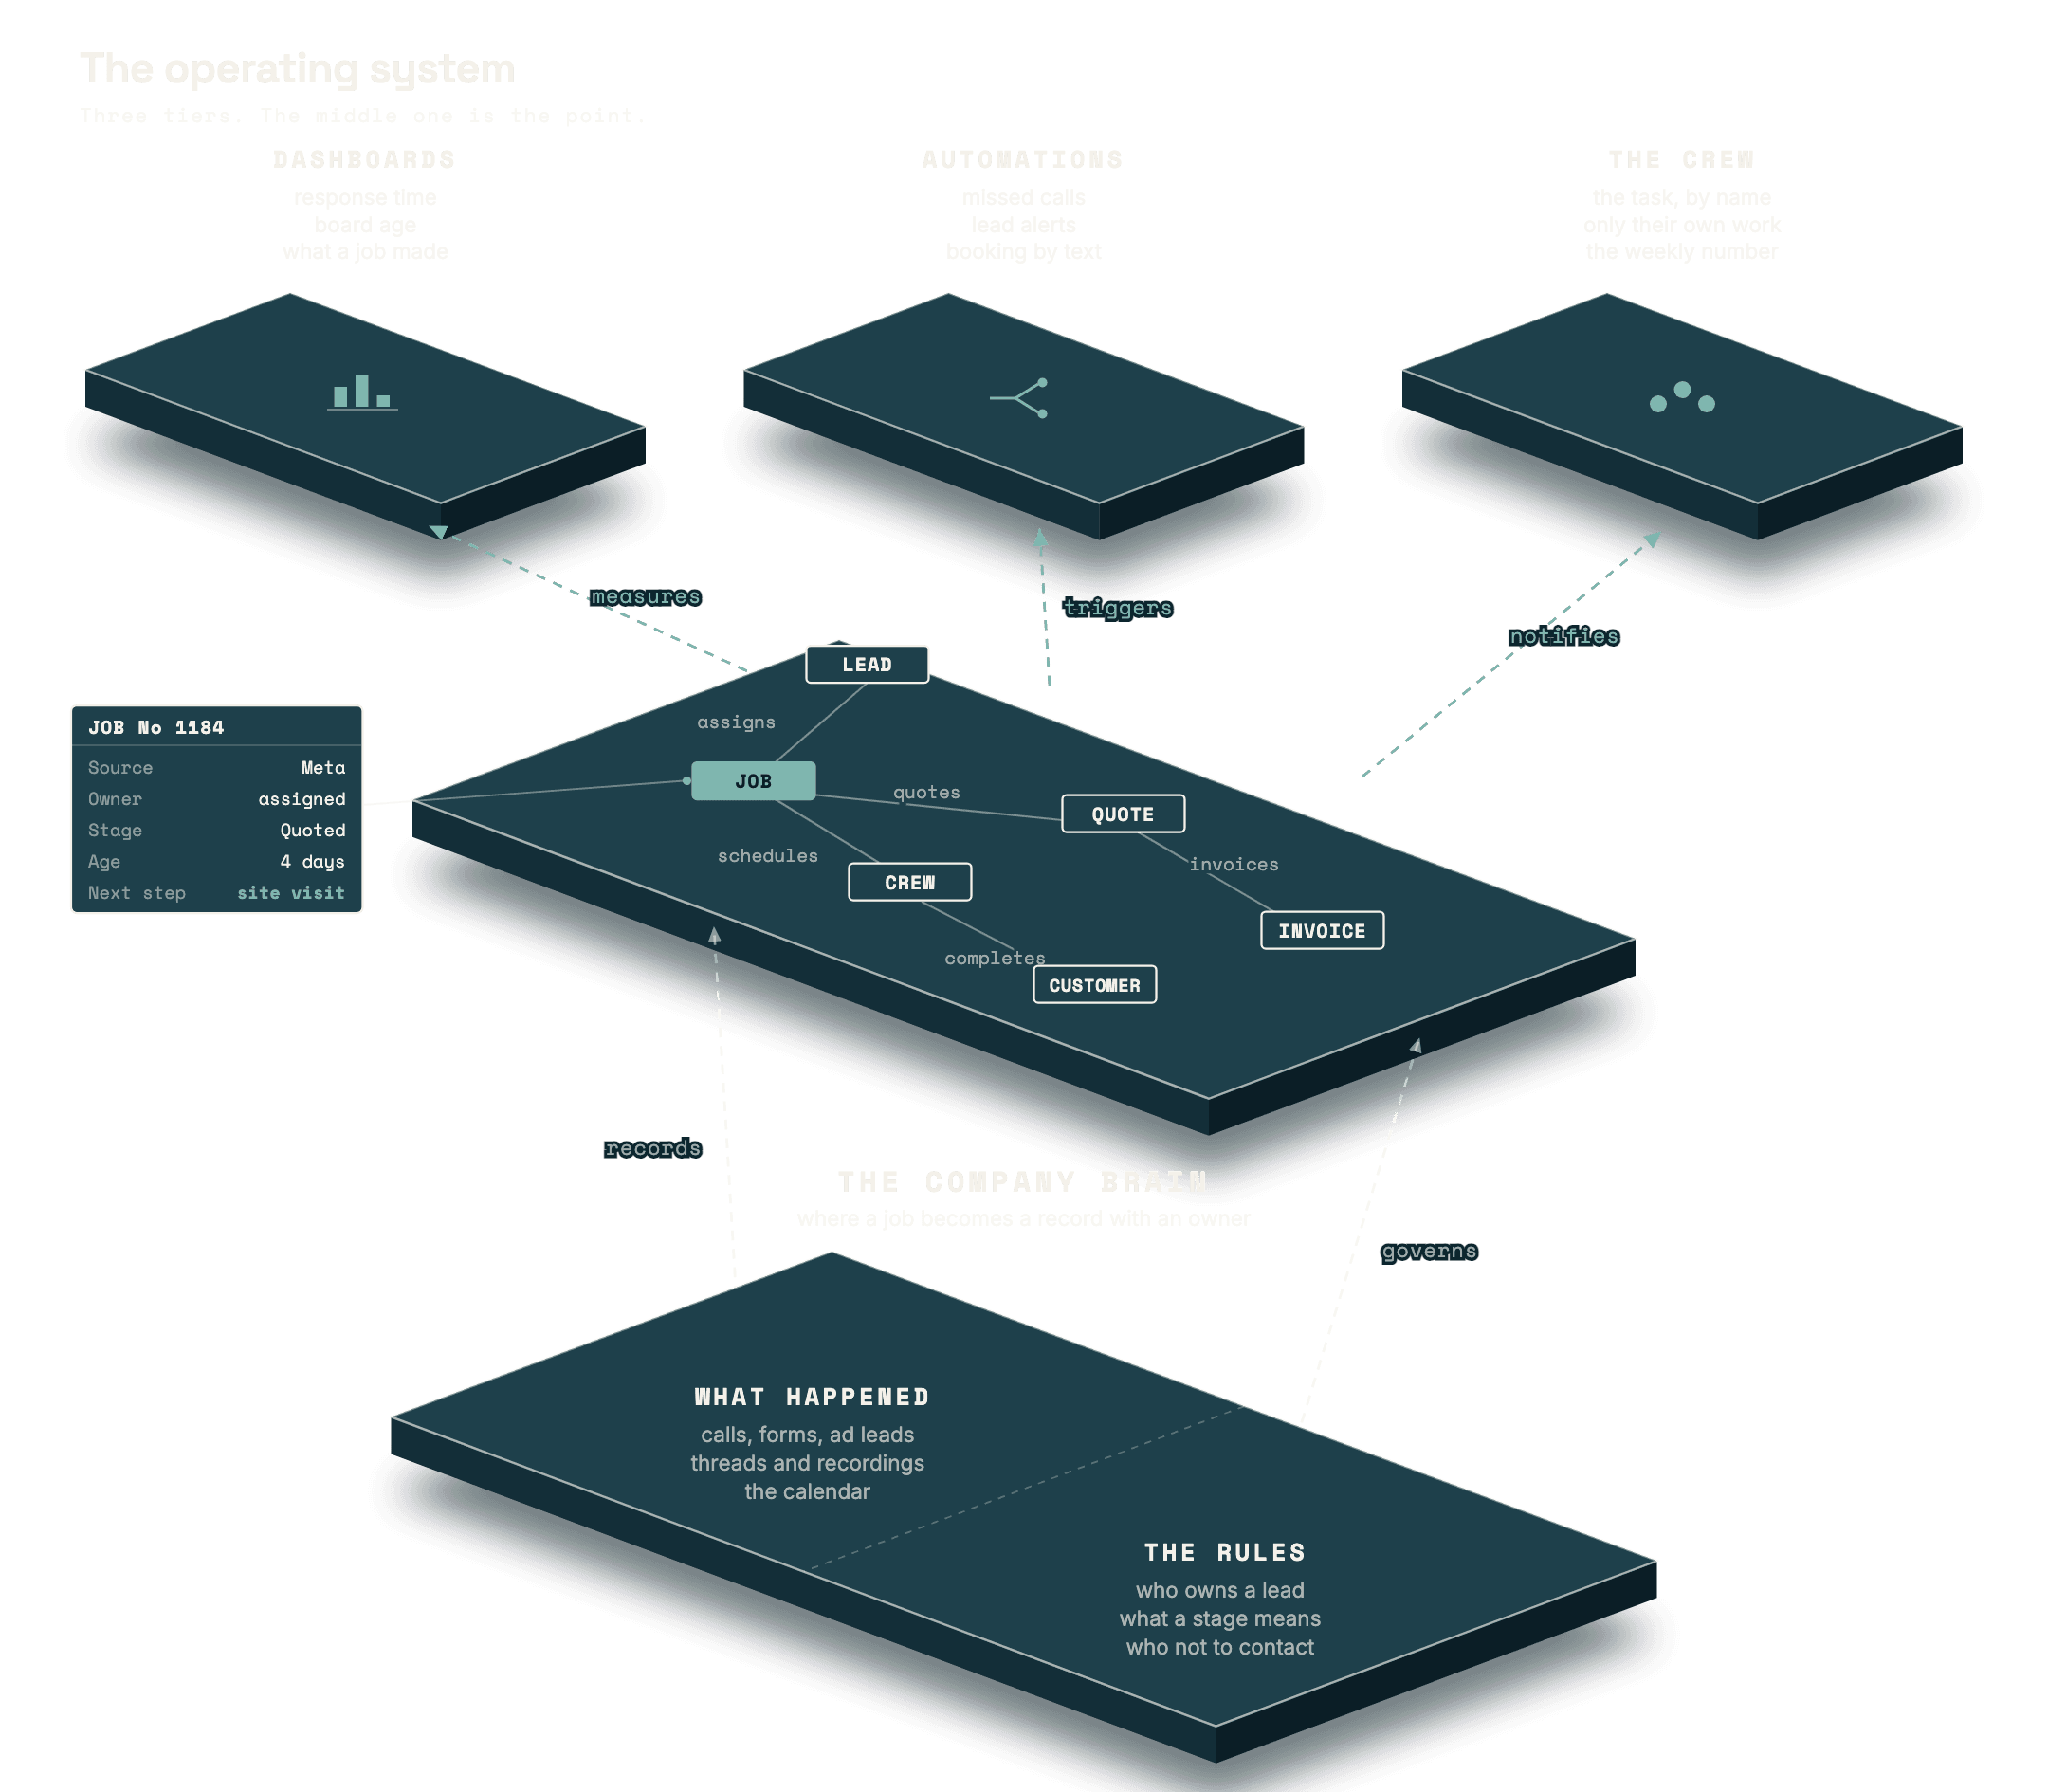
Your tools already hold the pieces.
Nothing holds them together.
The three things this
gets mistaken for.
Not
An agency
We do not sell you leads. The ringing was never the broken part.
Not
A product you rent
There is no licence and no seats. What gets built is yours.
Not
A hire
Nobody joins your payroll. If a person is the answer, we say so.
Client results
See every trade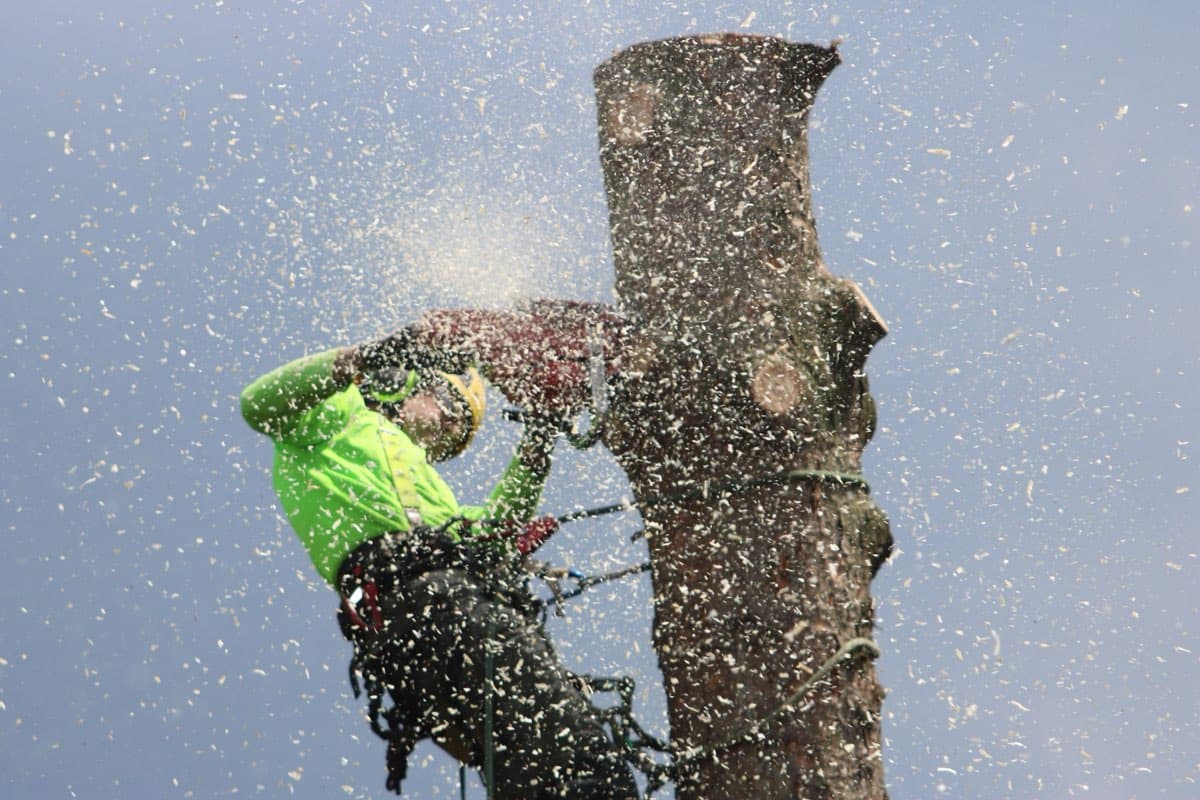
A 43% close rate for the month, on the line they already had, with no new leads bought.
Divine Tree Service
Sacramento, California
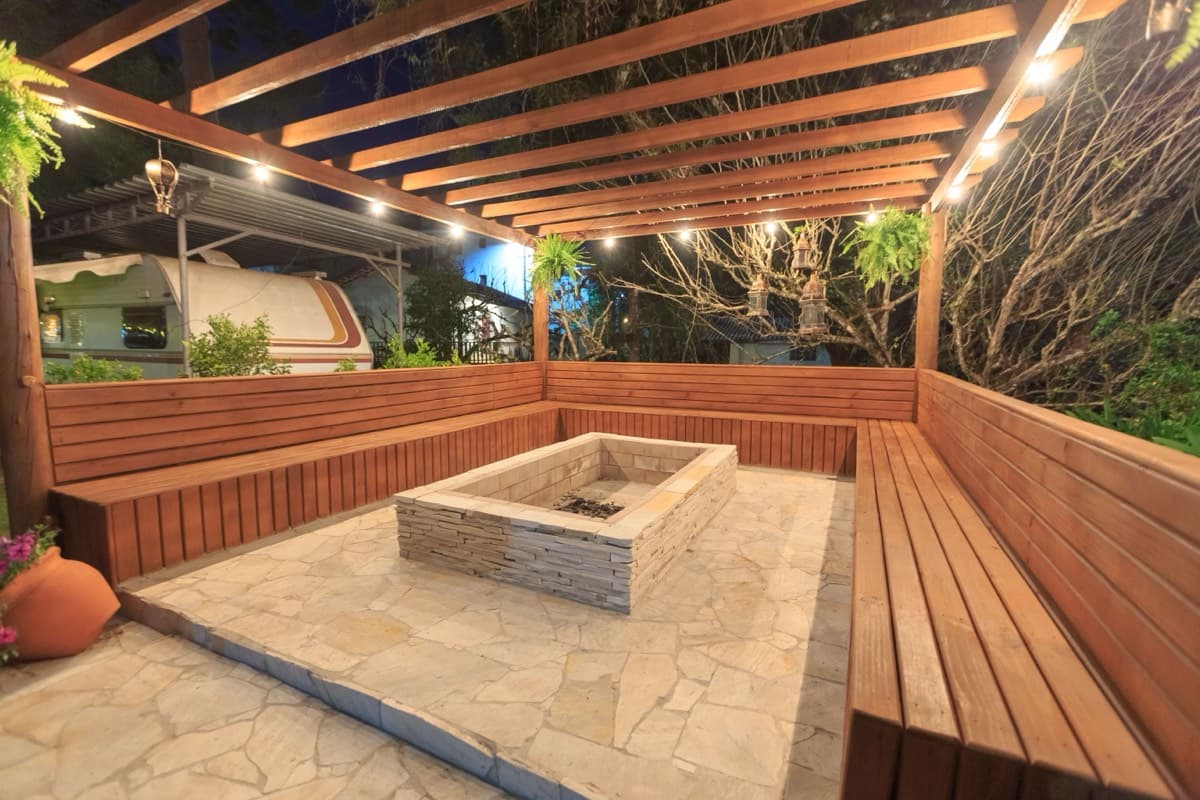
$56,700 of booked work from Meta ads alone, at their existing 30% close rate.
Exterior Improvement Incorporated
Sacramento, California
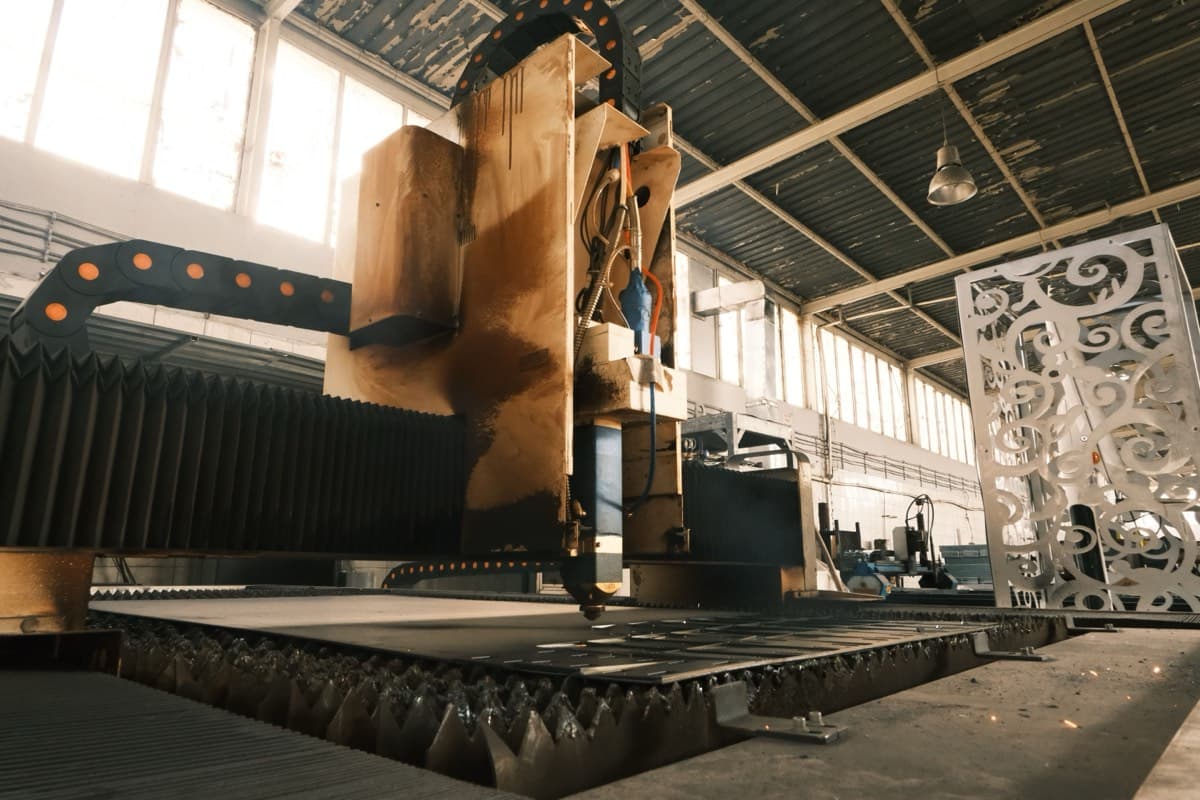
Manufacturing
Case study in progress
Nothing gets built until we know what it is replacing.
The map, the prototype, and the scoreboard.
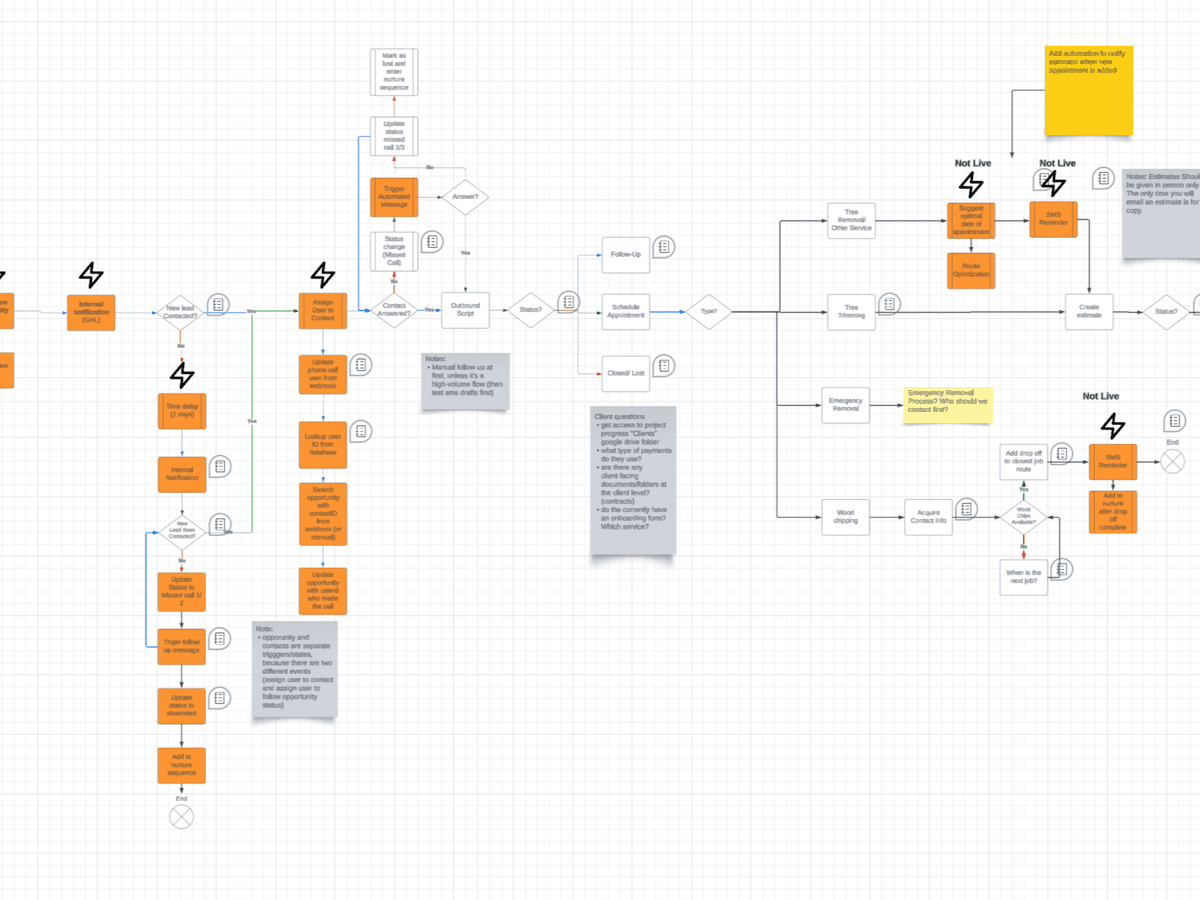
The map
Built from your own data before anything gets designed. This is where the gaps get found.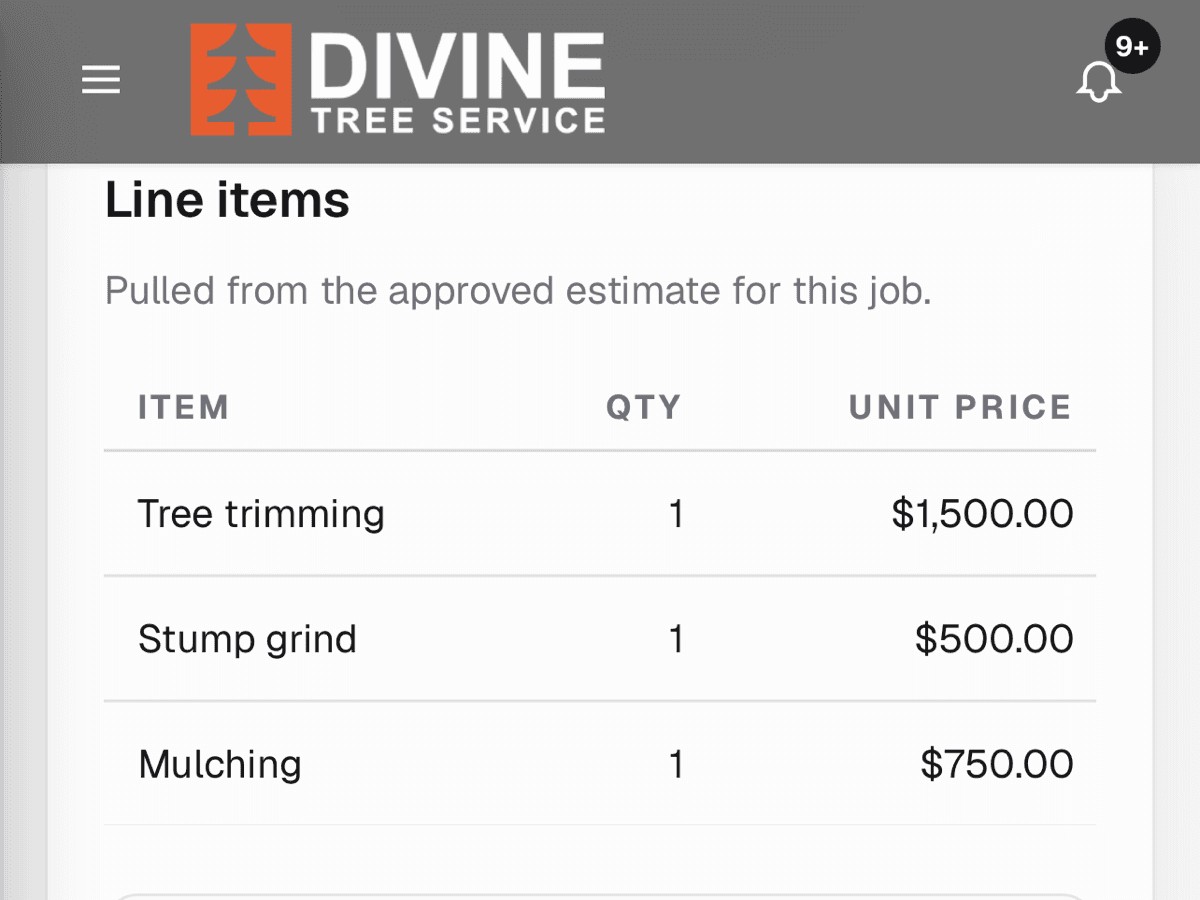
The prototype
Clickable before it is built, so the crew can break it while breaking it is still free.The figures on screen are seeded demo data.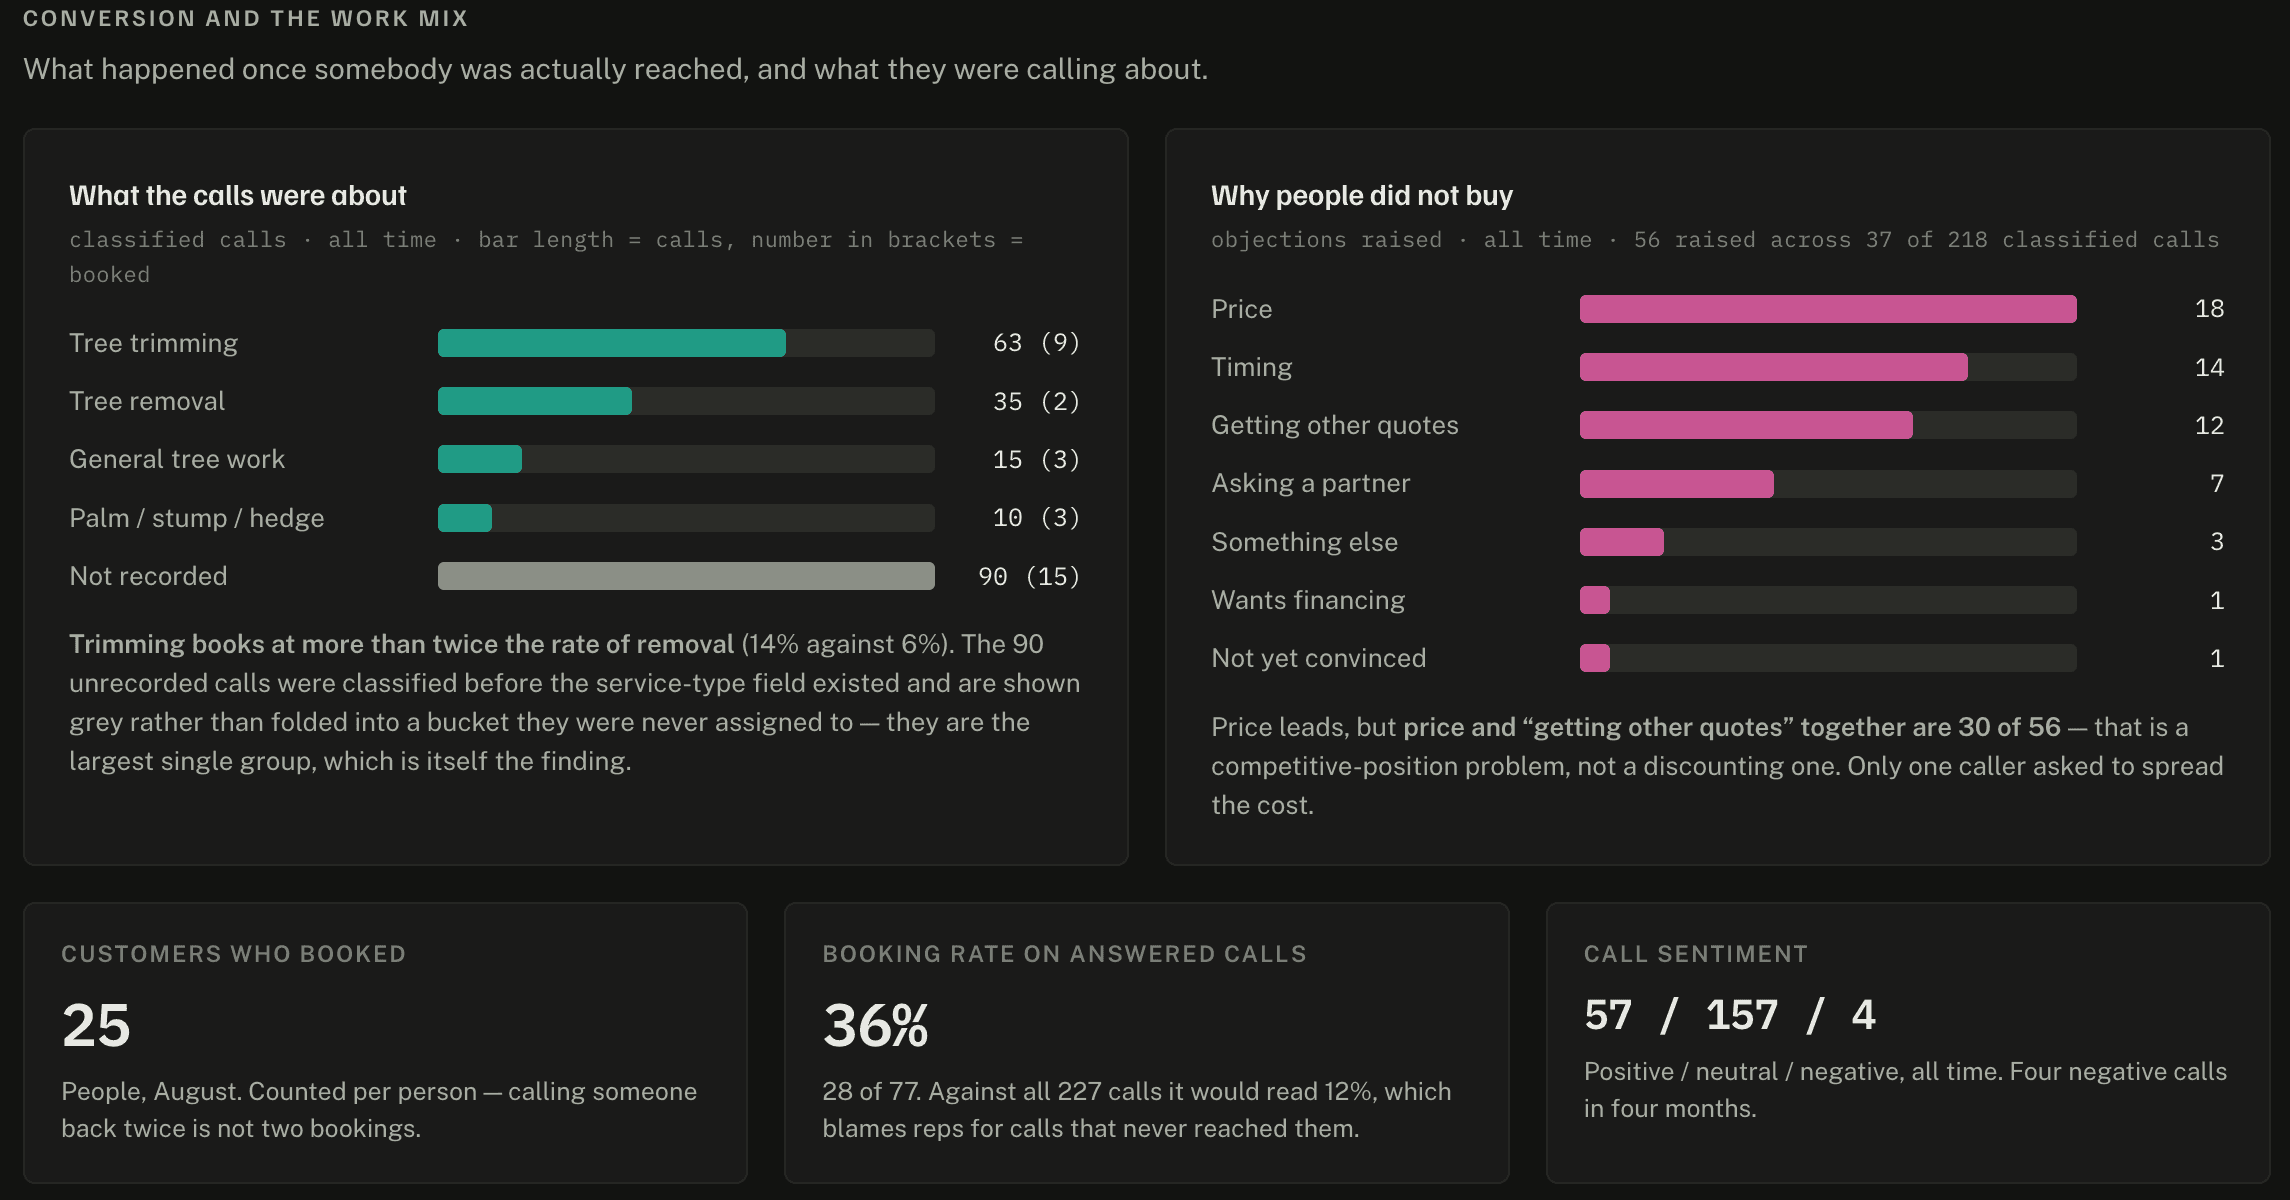
The scoreboard
Demand, objections and bookings, from calls that were being recorded rather than remembered.Divine Tree Service, four months to August 2026.Guarantees
Two of them,
and the second one costs us.
On the roadmap
If it tells you nothing you did not know
The ranked roadmap exists to surprise you. If it comes back and every gap on it was already obvious, you do not pay for that phase.
On anything we build
If a piece is not moving its number
Every piece is built against a number and measured from before it existed. One that is not moving that number gets switched off and drops out of what you pay. You will have seen it in your own weekly report before we raise it.
Neither of those is a refund of the whole build, and we are not going to imply otherwise. The map, the roadmap and every piece that is doing its job remain yours.
Start here
Bring us one job
you know you lost.
We find the place it actually died. Then multiply that one place by the number of times it happened last year, which is the part most owners are not ready for.
On the call
- One job you know you lost, traced from the ring that started it to the invoice that never came.
- The three points where it broke down, named rather than guessed at.
- You leave with the drawing of it, whether we ever work together or not.
Forty-five minutes. David takes these himself. Nothing for you to prepare and nothing to sit through.
Six questions, about two minutes.
We reply within one business day.